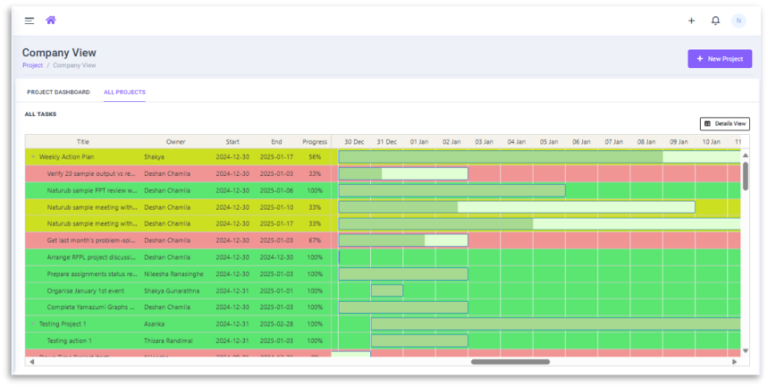
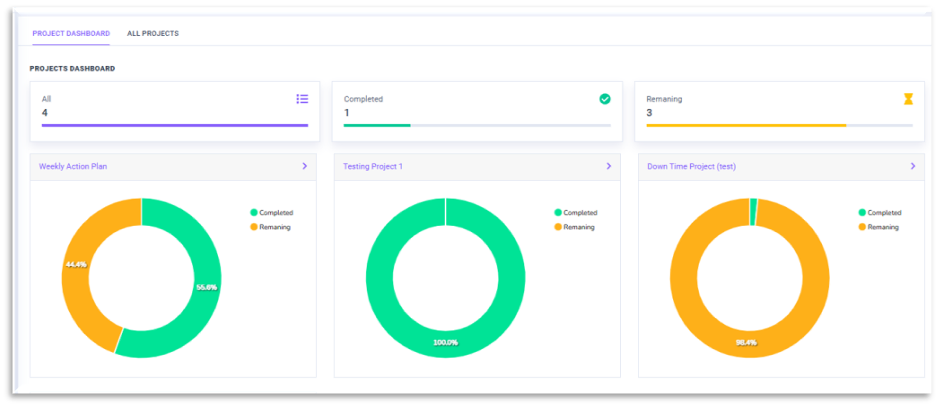
Overall Project Dashboard
A company can manage multiple projects simultaneously, allowing project leaders to quickly monitor the progress of each one. They can dive deeper into individual projects using the detailed Gantt chart view for a clearer understanding of timelines and milestones.